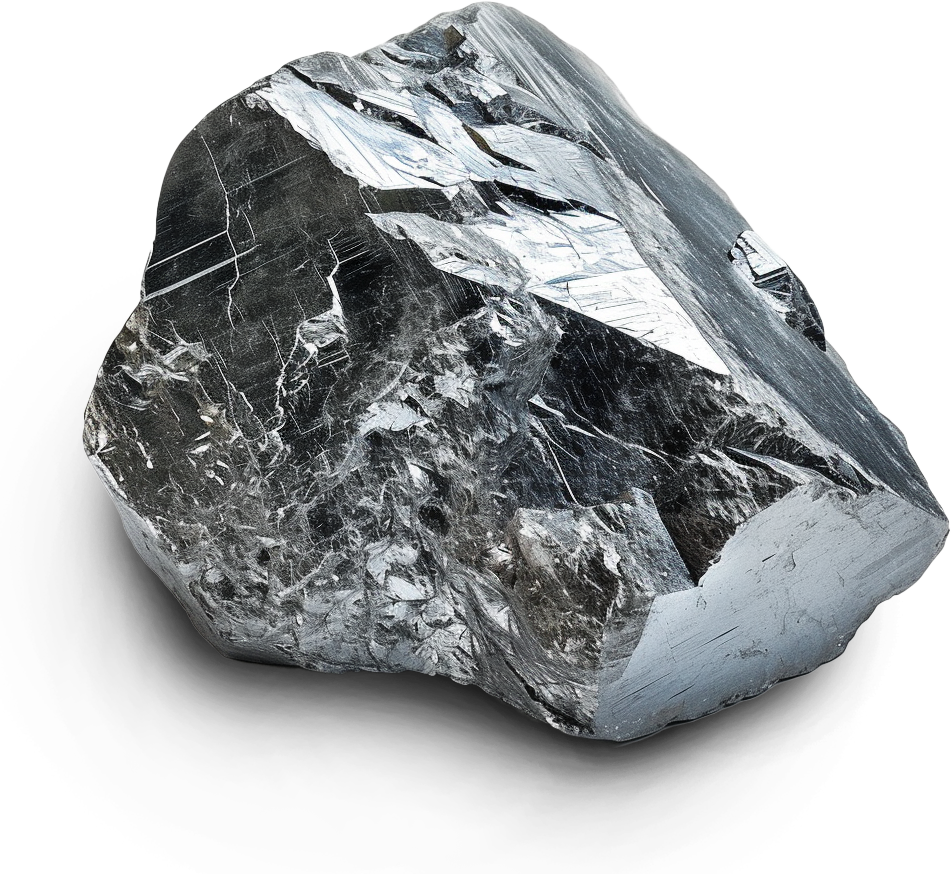
The main Iron-Titanium-Vanadium oxides mineralization reported here is the Farrell-Taylor deposit.
There are two additional deposits further west on trend at Hervieux East and Hervieux West to be included in the next global resource estimate.
There remains significant upside potential to further expand VTM/Ilmenite resources on the Project as evidenced in outcrop and EM mapping.
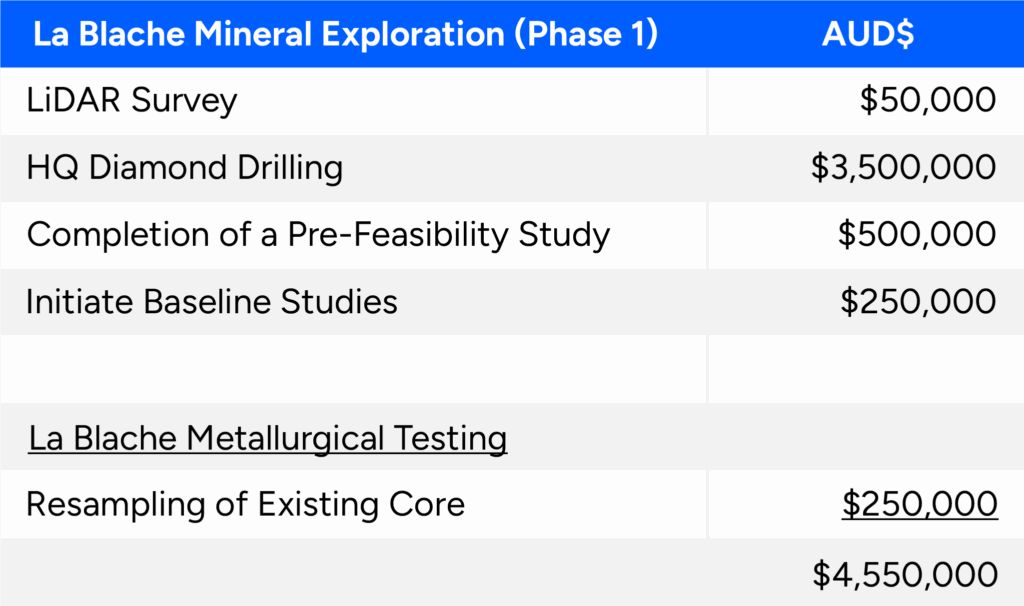
Plans include a comprehensive resampling of up to 24,658m of existing NQ core securely stored at a warehouse facility in La Baie, Quebec.
~ 7,000m of additional HQ sized infill diamond drilling resulting in a Measured and Indicated Resource calculation. We will acquire extensive sample material for continued refinement of the Company’s proprietary metallurgical process.
Baseline environmental and archaeological studies will be designed and initiated to assure minimal impacts during operations.
LiDAR survey will be conducted to determine pre-disturbance conditions and to allow for a more precise DEM to constrain the block model width.
Key components of the La Blache Field Program include:
The La Blache Project is comprised of 130 claims and covers approximately 7,000 hectares
100 km north of the community of Baie-Comeau, Quebec
The property is part of the La Blache Anorthosite Complex and hosts the Farrell-Taylor magnetite-ilmenite deposit
Proprietary TiO2, V2O5 and Fe2O3 processing and recovery technology through ORF Technologies Acquisition
Preliminary metallurgical testing of the oxide mineralization yielded 90% recovery of Iron and 95% recovery of Vanadium into a final high-purity product
A titanium dioxide (TiO2) product suitable for further processing to pigment-grade TiO2 was fully recoverable in testing
NI 43-101 Technical Report: Resource Estimation of the La Blache Project Cote-Nord, Quebec, Canada for Nevado Resources Corporation” provides a historic estimate that remains relevant due to its comprehensive nature and adherence to NI43-101 standards at the time. However, it doesn’t reflect updates made in 2014 to resource categories. Temas Resources, acknowledging the estimate’s limitations and lack of recent verification by a qualified person, does not currently classify it as a mineral resource under current CIM definitions.
| COG TiO2Eq (%) | Volume* | Tonnage* | Fe2O3 (%) | Fe (%) | TiO2 (%) | V (%) | V2O5 (%) | TiO2Eq (%) |
|---|---|---|---|---|---|---|---|---|
| 0 | 22,200,000 | 102,120,000 | 59.51 | 41.62 | 17.94 | 0.18 | 0.33 | 21.67 |
| 5 | 22,110,000 | 101,720,000 | 59.70 | 41.75 | 18.00 | 0.18 | 0.33 | 21.74 |
| 5.1 | 22,110,000 | 101,700,000 | 59.70 | 41.76 | 18.00 | 0.18 | 0.33 | 21.75 |
| 6.7 | 22,030,000 | 101,320,000 | 59.86 | 41.87 | 18.05 | 0.18 | 0.33 | 21.80 |
| 10 | 21,820,000 | 100,370,000 | 60.21 | 42.11 | 18.16 | 0.19 | 0.33 | 21.93 |
| 15 | 20,970,000 | 96,460,000 | 61.18 | 42.80 | 18.46 | 0.19 | 0.34 | 22.29 |